
This section discusses the cost per unit function, how much does every unit cost?
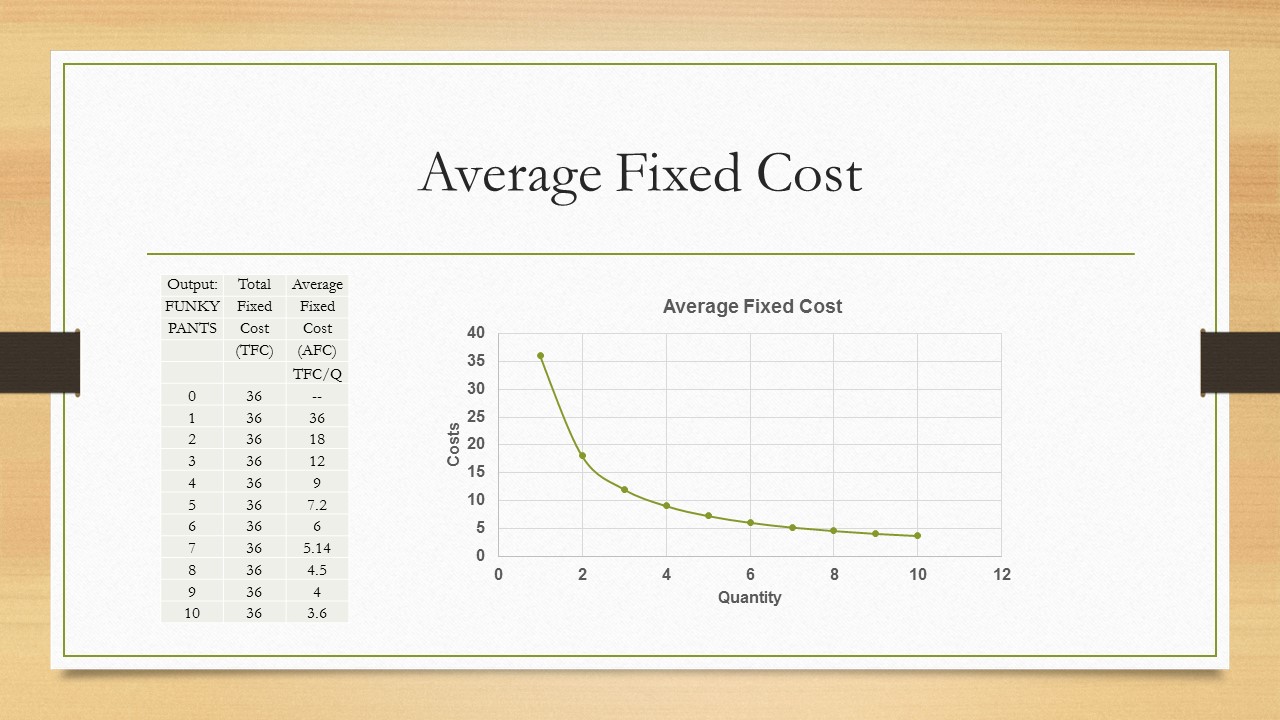
The Average Fixed Cost is the first cost per unit curve that we shall analyze. As the name implies it is calculated by using the total fixed cost discussed previously and determining the average cost per unit. Since we start with the total fixed cost and spread this number amongst an increasing number of units, the AFC becomes smaller and smaller. The formula takes the Total Fixed Cost and divides by the number of units, (Formula AFC = TFC/Q) – note that there is no AFC when you produce zero units, hence the first coordinate is at 1 unit! Below is a table and a graph of the AFC:
 The next cost curve is the Average Variable Cost, again as the name implies these data is obtained by taking the Total Variable Cost and dividing by the number of units. Average Variable Costs start high, go down and after added production go back up, almost like a smile! As production starts the work is not very efficient, after a while workers get better at their jobs and costs go down, eventually as production increases the costs of production increase, hence the shape of the curve. Remember no costs at Zero units, so the Average Variable Cost curve starts at one unit and continues at two units, three units, etc. (Formula AVC = TVC/Q). Below is the table for the Total Variable Cost with an added column to reflect the Average Variable cost:

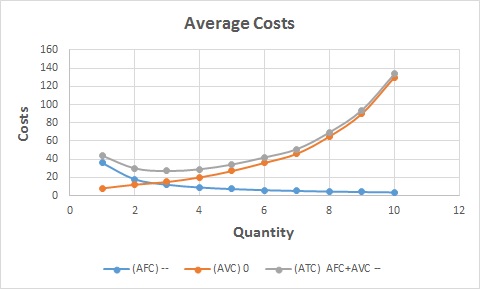
Now that we analyzed Average Fixed Cost and Average Variable Cost we combine them to build the Average Total Cost, the combination of total fixed and variable, just like we did with the Total Fixed and Total Variable Costs. There are two methods to obtain the Average Total Cost, the first one simple takes the AFC and AVC added together, the second one takes the Total Cost figures and divides by the quantity as we did before for the AFC and AVC. (Formula ATC = AFC + AVC) ) OR (Formula ATC = TC/Q). Both methods are displayed below, notice the end result is exactly the same!
| Output: FUNKY PANTS | Average Fixed Cost | Average Variable Cost | Average Total Cost |
|---|---|---|---|
| (AFC) | (AVC) | (ATC) = AFC+AVC | |
| 0 | -- | -- | -- |
| 1 | $36 | $8 | $44 |
| 2 | $18 | $12 | $30 |
| 3 | $12 | $15 | $17 |
| 4 | $9 | $20 | $29 |
| 5 | $7.2 | $27 | $34.2 |
| 6 | $6 | $36 | $38 |
| 7 | $5.14 | $46 | $51.14 |
| 8 | $4.5 | $65 | $69.5 |
| 9 | $4 | $90 | $94 |
| 10 | $3.6 | $130 | $133.6 |
Have you learned all there is to know about the cost per unit curves? Check your knowledge with the worksheets below:
1) Complete the table below by calculating the missing data:
| Quantity | Total Fixed Cost | Total Variable Cost | Total Cost | Average Fixed Cost | Average Variable Cost | Average Total Cost |
|---|---|---|---|---|---|---|
| 0 | $300 | $0 | 300 | --- | --- | --- |
| 1 | $75 | 75 | ||||
| 2 | 420 | 150 | ||||
| 3 | $300 | $150 | 450 | 150 | ||
| 4 | $360 | 90 | ||||
| 5 | $600 | 900 | 180 |
2) Graph the per unit (last three columns) cost curves for the table above.
3) Explain what would happen to the per unit cost tables if total fixed cost went up by $50.
4) Explain what would happen if variable cost went up by $30 at every level of production starting with unit 1.
5) Graph the average cost and average variable cost curves from numbers 3 and 4 above.
Yeahoo! This is the end of this lesson.