
Now we get into the most interesting and important cost curve, the Marginal Cost Curve. It is the additional cost of producing one more unit and later on will allow us to maximize profits. Yeahoo! I love profits $$$! As the production of pants increase, determining the additional cost of producing one more pant is crucial since that information will help us decide whether to produce or not that particular pair. In order to calculate the Marginal Cost we calculate the difference in Total Cost between the previous unit and the current unit. The table below calculates the Marginal Cost for Funky Pants:
| Quantity Funky Pants | Total Cost | Marginal Cost |
|---|---|---|
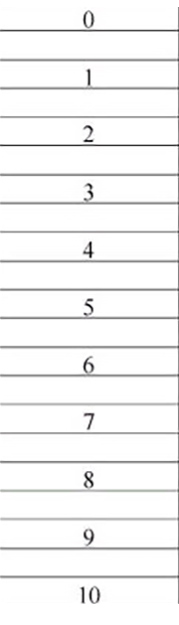 | 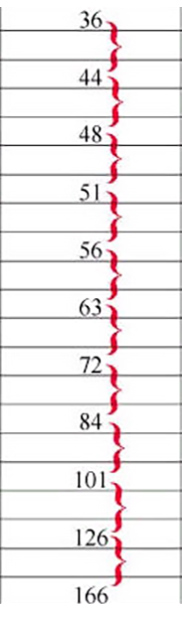 | 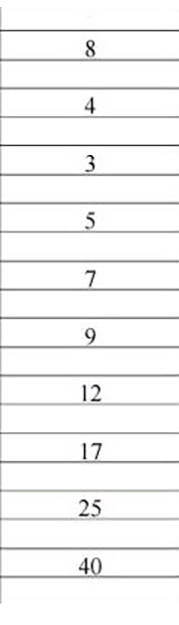 |
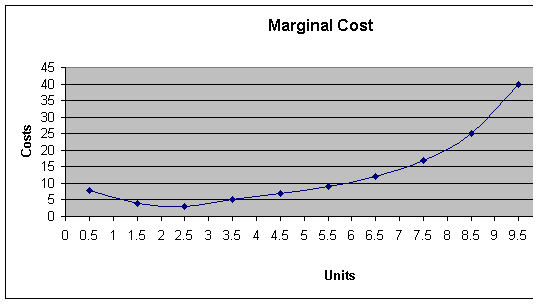
The calculations start with the first unit, as the cost went from $36 to $44, the marginal cost of producing the first unit is $8 ($44-$36), for the second unit the cost is $4, and so on. The arrows illustrate that the marginal cost is the additional cost of producing one more unit. Suppose someone offers you $25 for the eight pair of pants, would you sell it at $25? How much did it cost you to sew that particular pair? ($17, so sell!) The graph below shows why the Marginal Cost is more challenging to understand, notice that the coordinates are not exactly at 1,2,3..units, they are graphed at 0.5,1.5,2.5, etc. This is because the MC starts increasing as you start producing the units. In this case imagine you got your cloth and you add a zipper, costs have increased yet you are not finished with the pair of pants. In order to reflect that graphically economists graph the MC at mid point to account for the transition. This is a bit confusing yet useful in drawing accurate graphs and arriving at accurate conclusions!
As mentioned above graphing the marginal cost accurately is very important because this will help us determine important stages in production costs:
-
the intersection of the Marginal Cost and the Average Total Cost curves determines the lowest cost of production
-
the intersection of the Marginal Cost and the Average Variable Cost curves determines the “shut-down” point of production
The graph below will change to show how the increase in Costs will be reflected in the graph – please move your mouse over the image 🙂
When the additional cost of producing one more unit (Marginal Cost) reaches its lowest point, the Average Total Cost is at its lowest also, hence graphically the intersection of MC and ATC reflect the lowest cost per unit that may be achieved with the present production structure at Funky Pants. As stated earlier the intersection of MC and ATC reflect the lowest point of production, play animation.
Let’s review a complete set of numbers for the per unit cost of production:
| FUNKY PANTS | Average Fixed Cost (AFC) | Average Variable Cost (AVC) | Average Total Cost (ATC) = AFC+AVC | Marginal Cost (MC) |
|---|---|---|---|---|
| 0 | -- | - | -- | -- |
| 1 | 36 | 8 | 44 | 9 |
| 2 | 18 | 6 | 24 | 4 |
| 3 | 12 | 5 | 17 | 2 |
| 4 | 9 | 5 | 14 | 5 |
| 5 | 7.2 | 5.4 | 12.6 | 7 |
| 6 | 6 | 6 | 12 | 9 |
| 7 | 5.14 | 6.57 | 11.71 | 10 |
| 8 | 4.5 | 8.13 | 12.63 | 19 |
| 9 | 4 | 10 | 14 | 25 |
| 10 | 3.6 | 13 | 16.6 | 40 |
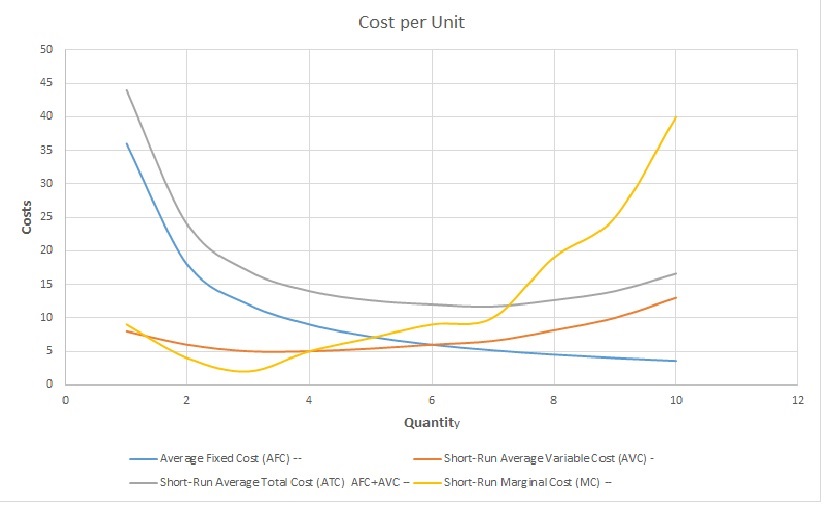 The intersection of Marginal Cost and Average Total Cost curve happens at 7 units, which tells us that the lowest cost of production is 7 pants, this would be the most efficient level of production at this stage of Funky Pants! Notice in the table $11.71 is the lowest average cost of production at a level of seven units. This is a very important rule: the intersection of the marginal cost curve and average total cost curve represent the lowest cost of production! Does this imply that we should stop production at this level to maximize profits? Not necessarily! This will be discussed in the profit maximization section of Microeconomics. Another intersection that is very relevant for future discussions of profits is the intersection of Average Variable Cost and Marginal Cost Curves. Again this discussion will be expanded in the next section of Microeconomics!
Practice your knowledge of the Marginal Cost Curve:
1. If the Total Cost of producing 98 burgers at “Junk-in-the-Bag” is $68, and the cost of producing 99 burgers is $68.95, what is the marginal cost of the 99th burger? Why?
2. Complete the table below:
| Quantity of Snow Boards | Total Fixed Cost | Total Variable Cost | Total Cost | Marginal Cost |
|---|---|---|---|---|
| 0 | $ | 0 | $ | -- |
| 1 | $ | $ 78 | $ | |
| 2 | $ | $ 128 | $ | |
| 3 | $ | $ 150 | $ | |
| 4 | $ | $ 200 | $ | |
| 5 | $ | $ 259 | $ | |
| 6 | $ | $ 360 | $ | |
| 7 | $ | $ 480 | $ | |
| 8 | $ | $ 650 | $ | |
| 9 | $ | $ 900 | $ | |
| 10 | $ | $ 1,300 | $ |
3. Graph the Marginal Cost from number 2 above.
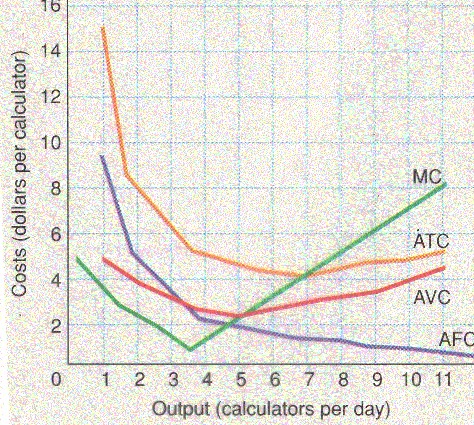
4. Given the graph below, estimate the lowest average total cost per unit of production and the number of units produced at this cost. Explain how you arrived at your answers.
 Great! You finished the Marginal Cost lesson!