|
Statistics
for the Behavioral Sciences |
Lesson 6
The Normal Curve |
Roger N. Morrissette, PhD |
I. The Normal Curve (Video
Lesson 6 I) (YouTube
version)
A Normal Curve is a distribution of
data with most of the scores clustered around the middle. The curve is
bell-shaped and symmetrical. In a Normal Curve the mean, median, and mode
are all equal and the frequency of the other scores gradually lessen on both
sides. It has zero skew. The curve approaches but never meets the abscissa
at both the high and low ends. Most data collected tends to be normally
distributed or is said to have a normal curve. The normal curve reflects
that most behavior is “normal.” Extremes of behavior are rare and found at
either end of the curve.
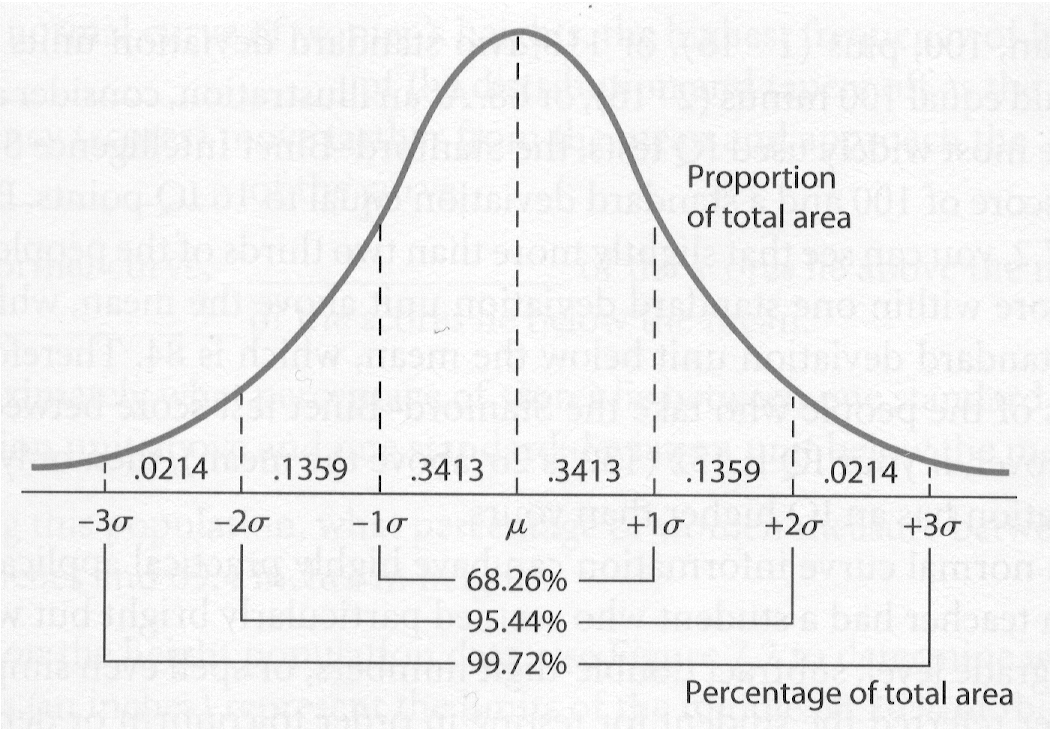
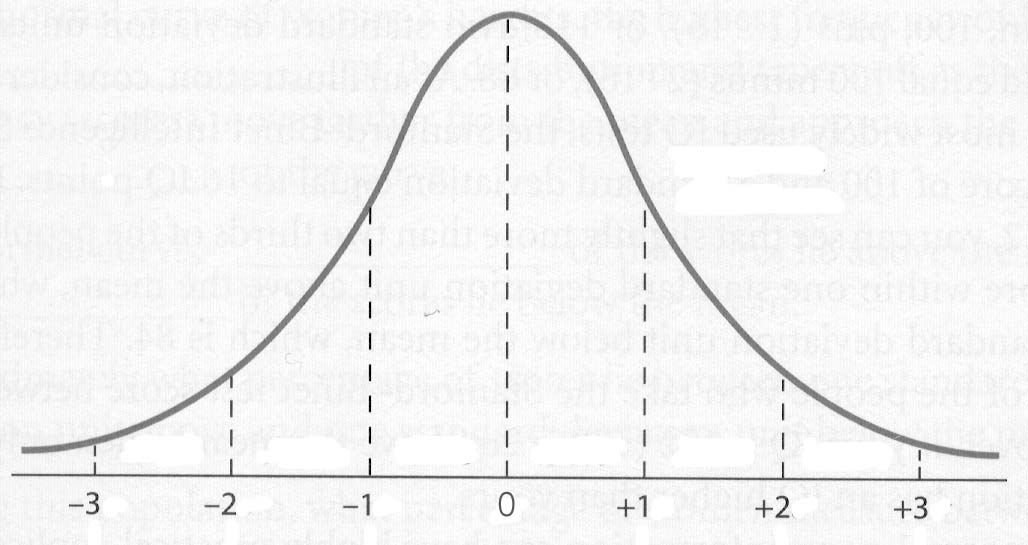
Area Under
the Normal Curve. If we assume that the total area under the
Normal Curve equals 100% and the area below and above the mean equal 50%
respectively, then the figure below gives the respective percentages within
the first, second and third standard deviations:
II. Standard Scores (Video
Lesson 6 II) (YouTube
version)
Standard scores are used when you want to compare two distributions of data that
have significantly different means and standard deviations. Standard scores
allows us to compare apples and oranges, if you will. For example: Say you are a
manager of a company and you are trying to decide which of your employees should
get a bonus. A bonus will only be granted if an employee scores above average on
two criteria. If these criteria have different means and standard deviations,
then converting all of your criteria to standard scores will help you make your
decision.
|
Employee |
Customer
Rating |
Quarterly
Sales Volume |
| Aparna |
15 |
76,000 |
| Dave |
2 |
55,000 |
| Latika |
21 |
39,000 |
| Gloria |
17 |
100,000 |
| Rasheed |
10 |
20,000 |
| |
Xbar =
13 |
Xbar =
58,000 |
|
|
s = 7.314 |
s = 31,233 |
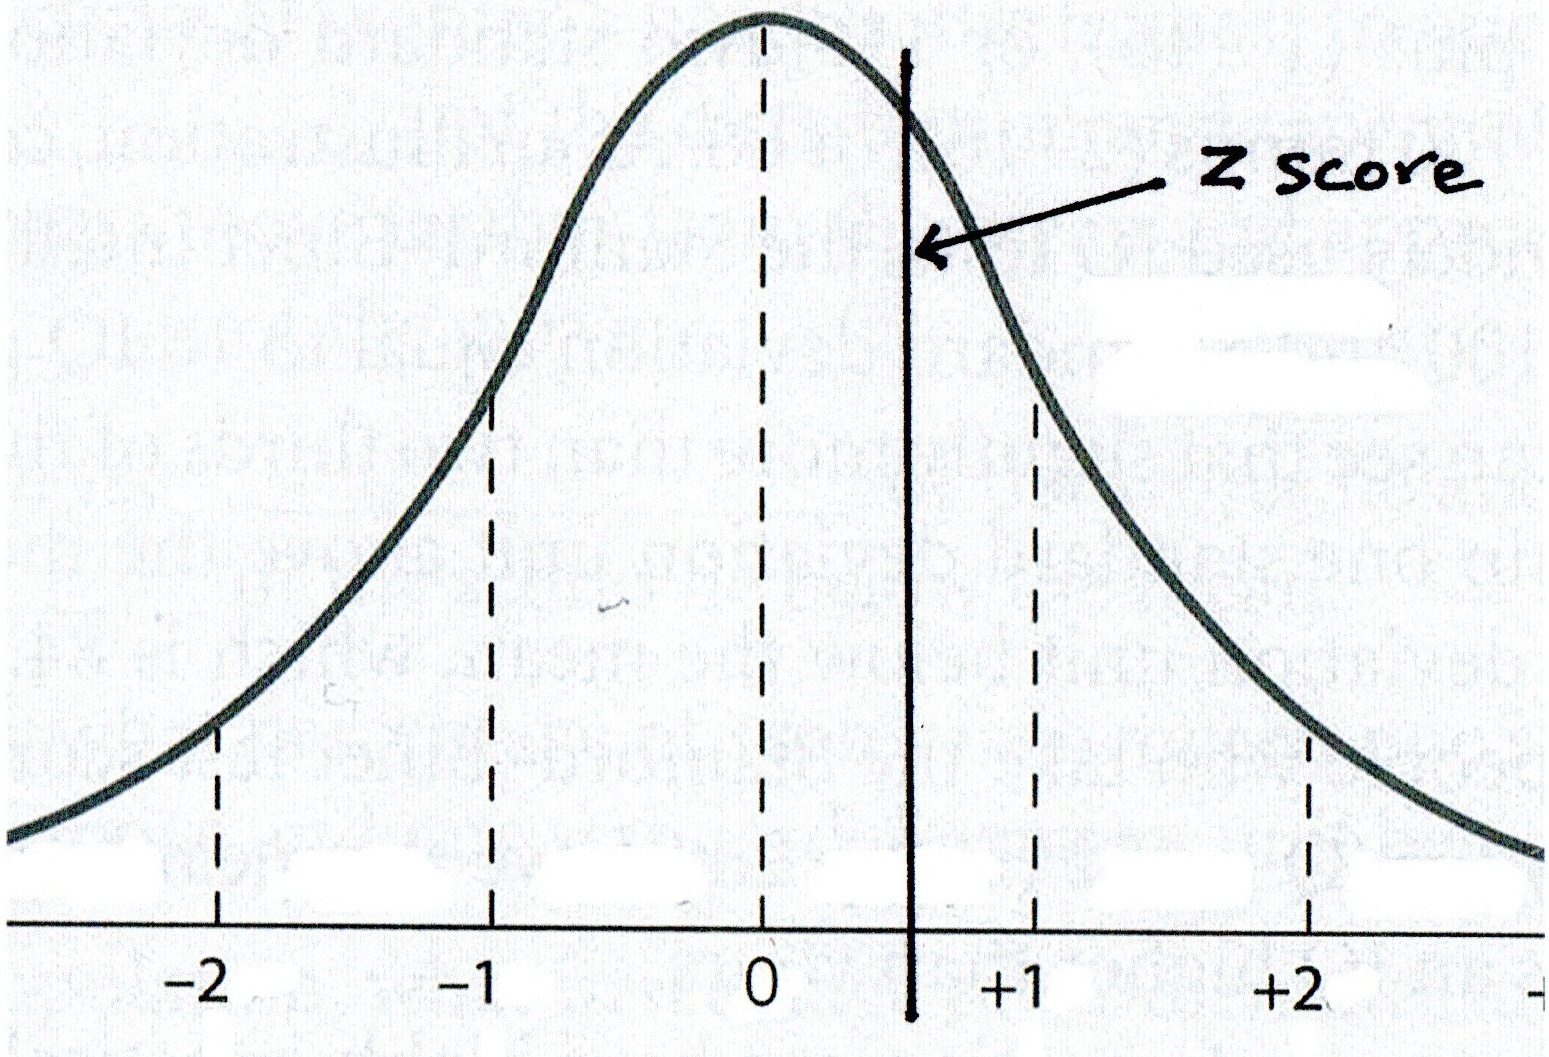
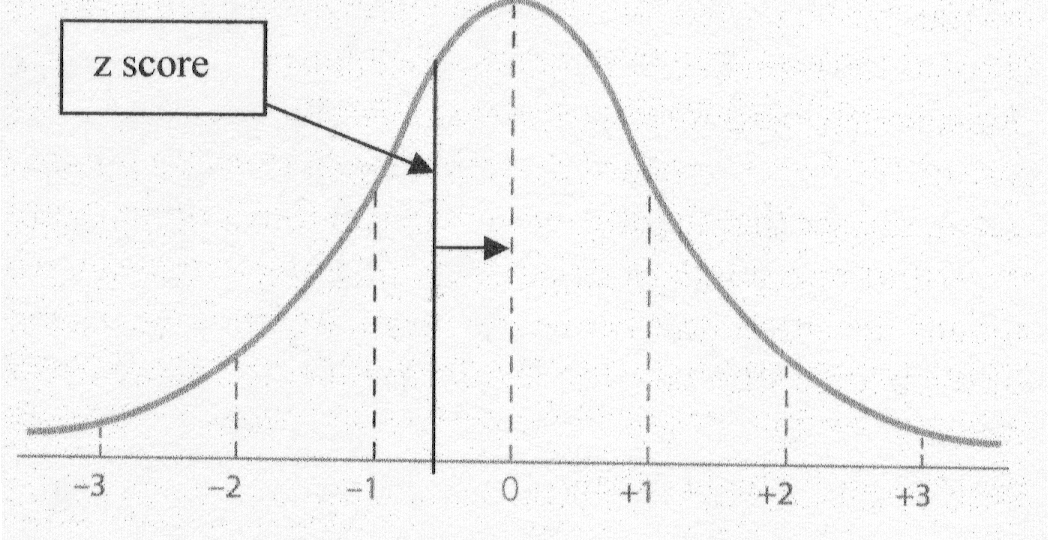
A. z scores
The most commonly used standard score is the z score. Z
scores have a mean of 0 and a standard deviation of 1. Once a distribution has
been converted to z scores it can be compared to any other distribution that has been converted to z
scores. The formula for calculating z scores is shown below:

The formula reads: z
equals the raw score of a sample minus the mean of that sample divided by the
standard deviation of that sample.
So now we can convert
each of the two different sets of raw scores into z scores:
|
Employee |
X1 |
z1 |
X2 |
z2 |
| Aparna |
15 |
0.27 |
76,000 |
0.58 |
| Dave |
2 |
-1.50 |
55,000 |
-0.10 |
| Latika |
21 |
1.09 |
39,000 |
-0.61 |
| Gloria |
17 |
0.55 |
100,000 |
1.34 |
| Rasheed |
10 |
-0.41 |
20,000 |
-1.22 |
| |
Xbar =
13 |
|
Xbar =
58,000 |
|
|
|
s = 7.314 |
|
s = 31,233 |
|
With the new z scores we can do a better comparison of the two different
data sets. Remember that a z score close to zero is close to the mean of the
distribution. Negative z scores are below the mean and positive z scores are
above the mean. For both of these categories we want values that are
above the mean. Only our employees that have scores that are better than
average in both categories will get a bonus.
|
Employee |
Customer Rating |
Quarterly Sales Volume |
| Aparna |
0.27 |
0.58 |
| Dave |
-1.50 |
-0.10 |
| Latika |
1.09 |
-0.61 |
| Gloria |
0.55 |
1.34 |
| Rasheed |
-0.41 |
-1.22 |
Since Aparna and Gloria are the only two employees that had both scores
above the mean, they will be the only ones to get a bonus.
B. T scores
Z scores are an excellent standard score for most people. The only real
downside of z scores is that you have to deal with negative numbers. For those
people that are uncomfortable with negative numbers, the T score can be
used. The T score has a mean of 50 and a standard deviation of 10.
To calculate a T score you must first calculate the z score as above. Once the
z score has been identified for each raw score you can use the formula below
to convert these z scores into T scores:
T = (z)(10) + 50
The formula reads: T
equals the z score times 10 and then plus 50.
The table below shows the
same data as above but as T scores:
|
Employee |
Customer Rating |
Quarterly Sales Volume |
| Aparna |
52.7 |
55.8 |
| Dave |
35.0 |
49 |
| Latika |
60.9 |
43.9 |
| Gloria |
55.5 |
63.4 |
| Rasheed |
45.9 |
37.8 |
III. Using Standard Scores and the Z Table to Find Proportions
under a Normal Curve: (Video
Lesson 6 III) (YouTube
version)
The
Z Table is located in Appendix A in the back of the text book. It gives the proportions of area under the Normal Curve for all z scores.
It has three very important columns:
Column 1: lists the positive z scores from 0.00 to 3.70
| z |
Area Between Mean and z |
Area Beyond
z |
z |
Area Between Mean and z |
Area Beyond
z |
| 1 |
2 |
3 |
1 |
2 |
3 |
| 0.00 |
.0000 |
.5000 |
0.20 |
.0793 |
.4207 |
| 0.01 |
.0040 |
.4960 |
0.21 |
.0832 |
.4168 |
| 0.02 |
.0080 |
.4920 |
0.22 |
.0871 |
.4129 |
| 0.03 |
.0120 |
.4880 |
0.23 |
.0910 |
.4090 |
| 0.04 |
.0160 |
.4840 |
0.24 |
.0948 |
.4052 |
| |
|
|
|
|
|
| 0.05 |
.0199 |
.4801 |
0.25 |
.0987 |
.4013 |
| 0.06 |
.0239 |
.4761 |
0.26 |
.1026 |
.3974 |
The table continues for 5 more pages
Since the Normal Curve is perfectly symmetrical, negative and positive z scores
are treated equally. Negative z scores are the mirror opposite of the positive
values. There are no negative z scores in the Z Table so simply use the positive
value of the z in Column 1.
Column 2: lists the area of a Normal Curve
from the z score to the mean
| z |
Area Between Mean and z |
Area Beyond
z |
z |
Area Between Mean and z |
Area Beyond
z |
| 1 |
2 |
3 |
1 |
2 |
3 |
| 0.00 |
.0000 |
.5000 |
0.20 |
.0793 |
.4207 |
| 0.01 |
.0040 |
.4960 |
0.21 |
.0832 |
.4168 |
| 0.02 |
.0080 |
.4920 |
0.22 |
.0871 |
.4129 |
| 0.03 |
.0120 |
.4880 |
0.23 |
.0910 |
.4090 |
| 0.04 |
.0160 |
.4840 |
0.24 |
.0948 |
.4052 |
| |
|
|
|
|
|
| 0.05 |
.0199 |
.4801 |
0.25 |
.0987 |
.4013 |
| 0.06 |
.0239 |
.4761 |
0.26 |
.1026 |
.3974 |
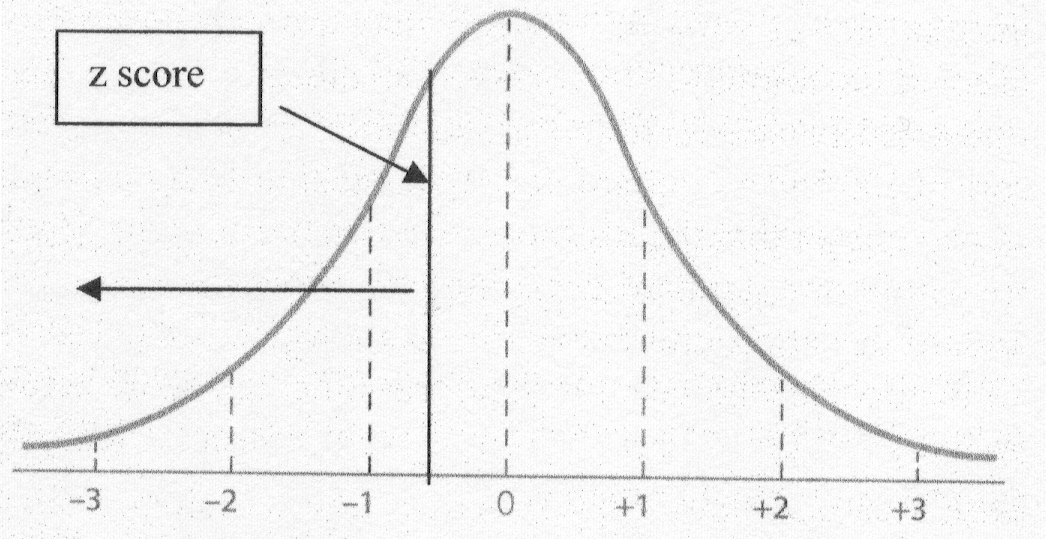
Column 3: lists the area of a Normal Curve from the z score to the
end of the tail
| z |
Area Between Mean and z |
Area Beyond
z |
z |
Area Between Mean and z |
Area Beyond
z |
| 1 |
2 |
3 |
1 |
2 |
3 |
| 0.00 |
.0000 |
.5000 |
0.20 |
.0793 |
.4207 |
| 0.01 |
.0040 |
.4960 |
0.21 |
.0832 |
.4168 |
| 0.02 |
.0080 |
.4920 |
0.22 |
.0871 |
.4129 |
| 0.03 |
.0120 |
.4880 |
0.23 |
.0910 |
.4090 |
| 0.04 |
.0160 |
.4840 |
0.24 |
.0948 |
.4052 |
| |
|
|
|
|
|
| 0.05 |
.0199 |
.4801 |
0.25 |
.0987 |
.4013 |
| 0.06 |
.0239 |
.4761 |
0.26 |
.1026 |
.3974 |
A Special Note: The Z Table
only gives the proportions for one half of the normal curve. If you add the
proportion values from column two and column three for any z score you will find
that they equal .5000 or 50%.
IV. Using Normal Curve Proportions
Once you assume that your data can be represented by a Normal Curve, you
can now use the proportions of that curve to tell you information about a raw
scores relative to the curve. For instance: You can calculate the proportion
(or percentage) of raw scores that falls above or below a specific raw score.
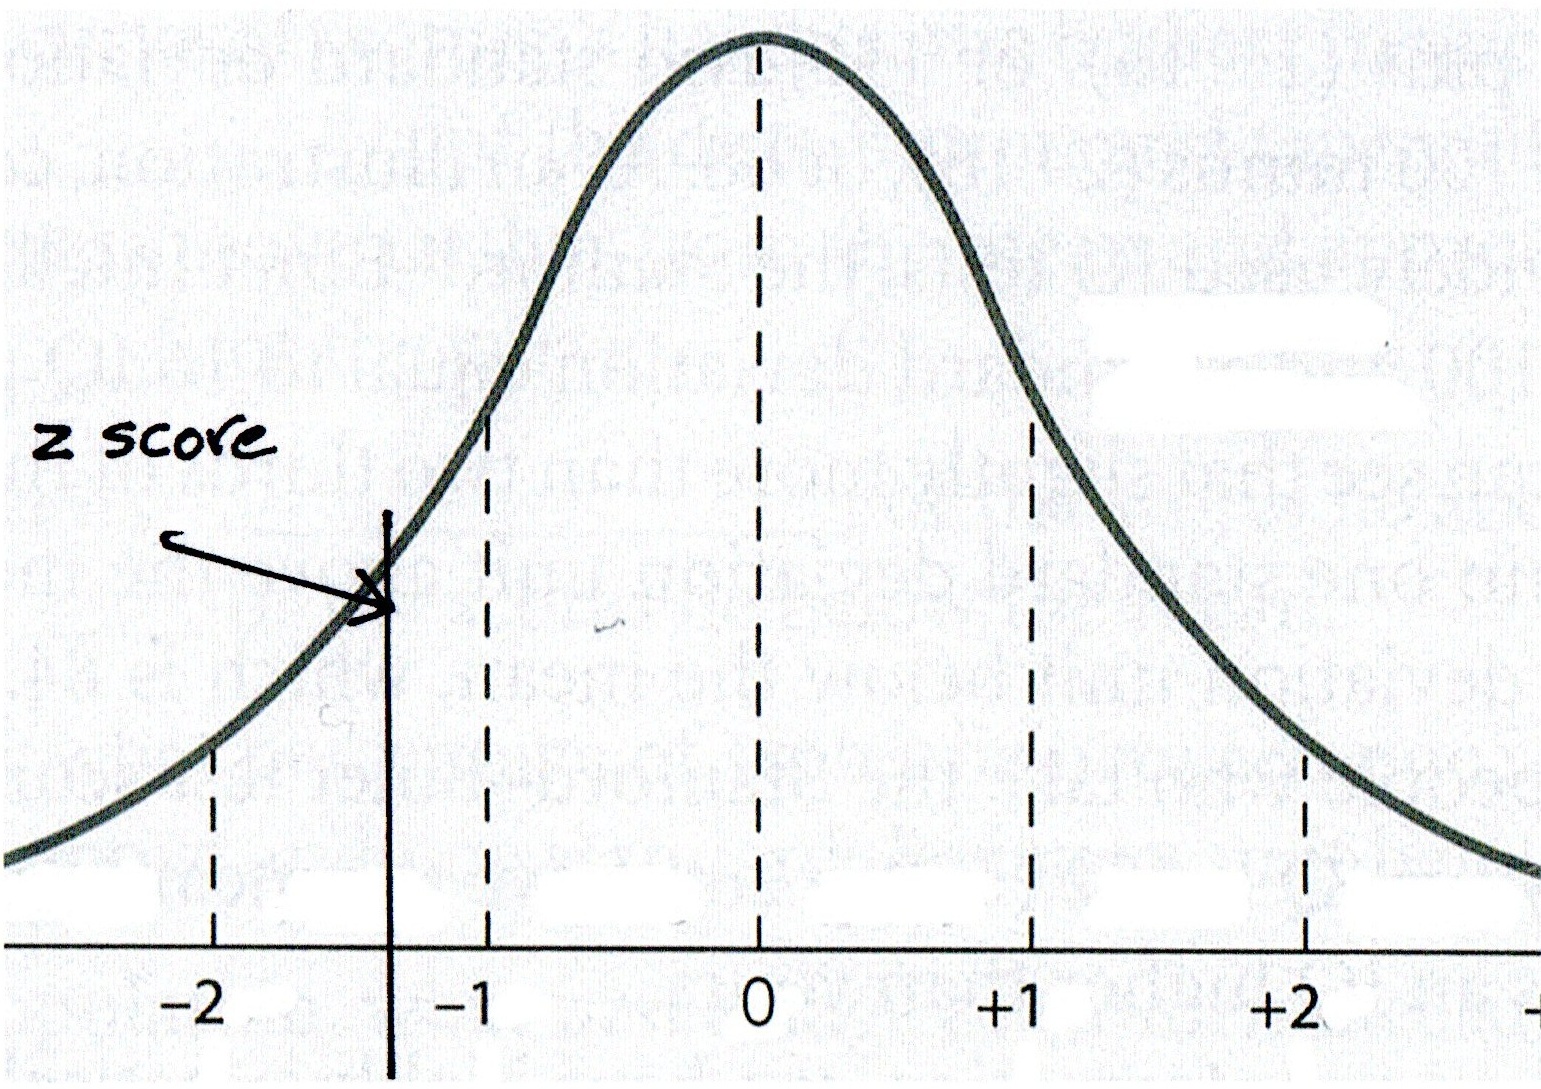
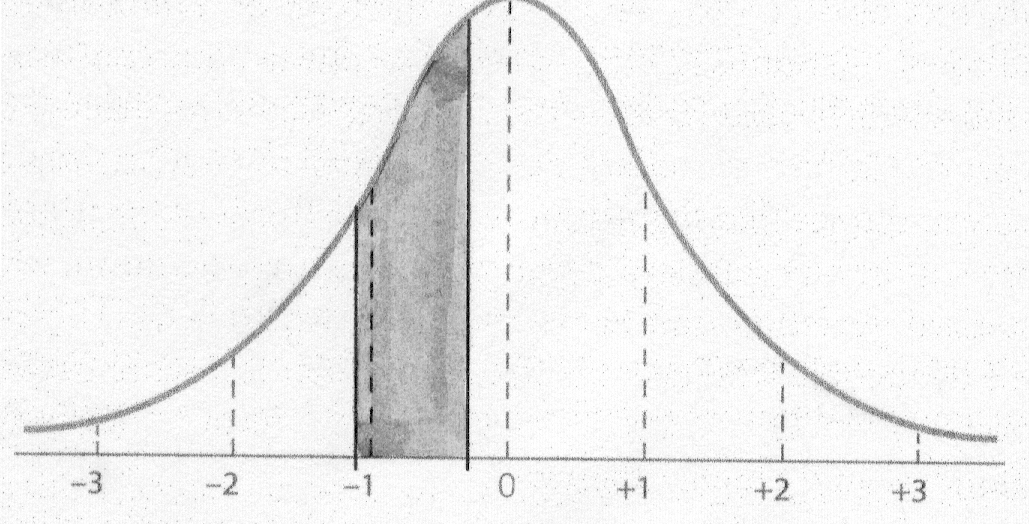
Question #1: The mean of Dr. Morrissette's first statistics exam was
71. The standard deviation was 14. If you received a 68 on the test, what
proportion of people scored below you?
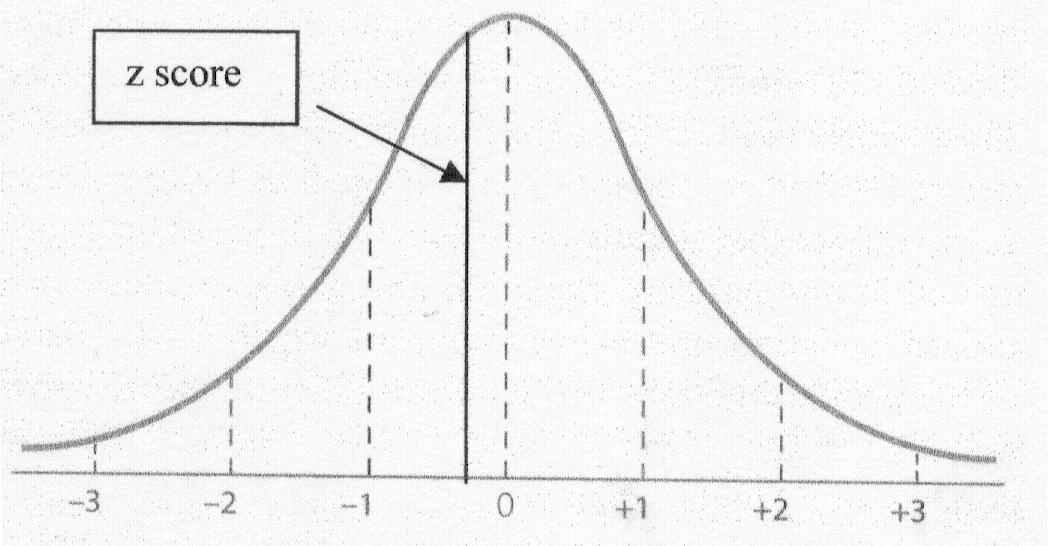
Step 1:
Draw a Normal Curve with z score mean and standard deviations.
Step 2: Calculate the z score.
since the z is the raw score minus the mean divided by the
standard deviation we have all the information we need
z = (68 - 71) / 14
z = - 0.21
Step 3: Identify the z score on your Normal Curve.
Step 4: Shade the area asked for in the question.
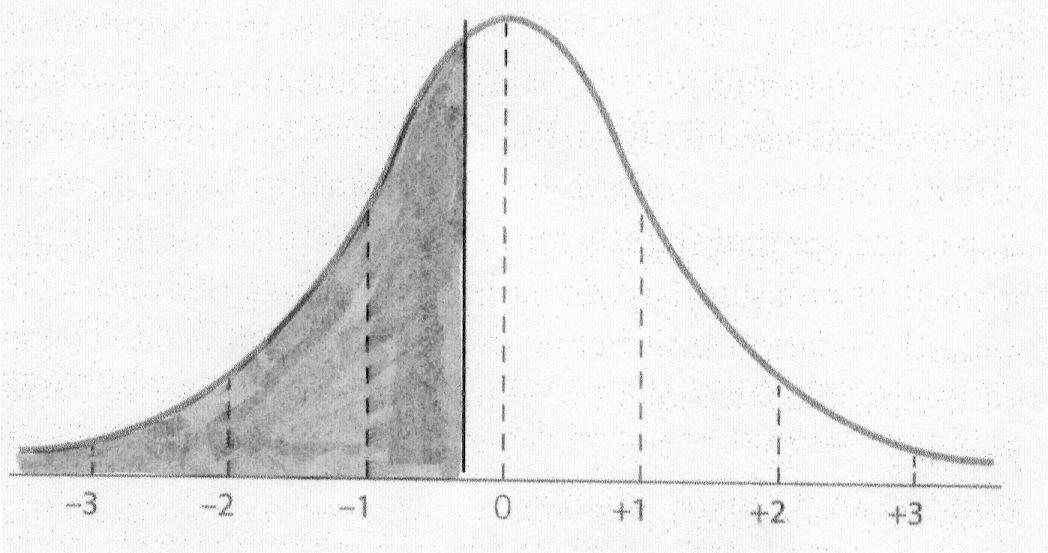
Step 5: Go to the Z Table and find the proportion.
| z |
Area Between Mean and z |
Area Beyond
z |
z |
Area Between Mean and z |
Area Beyond
z |
| 1 |
2 |
3 |
1 |
2 |
3 |
| 0.00 |
.0000 |
.5000 |
0.20 |
.0793 |
.4207 |
| 0.01 |
.0040 |
.4960 |
0.21 |
.0832 |
.4168 |
| 0.02 |
.0080 |
.4920 |
0.22 |
.0871 |
.4129 |
| 0.03 |
.0120 |
.4880 |
0.23 |
.0910 |
.4090 |
| 0.04 |
.0160 |
.4840 |
0.24 |
.0948 |
.4052 |
| |
|
|
|
|
|
| 0.05 |
.0199 |
.4801 |
0.25 |
.0987 |
.4013 |
| 0.06 |
.0239 |
.4761 |
0.26 |
.1026 |
.3974 |
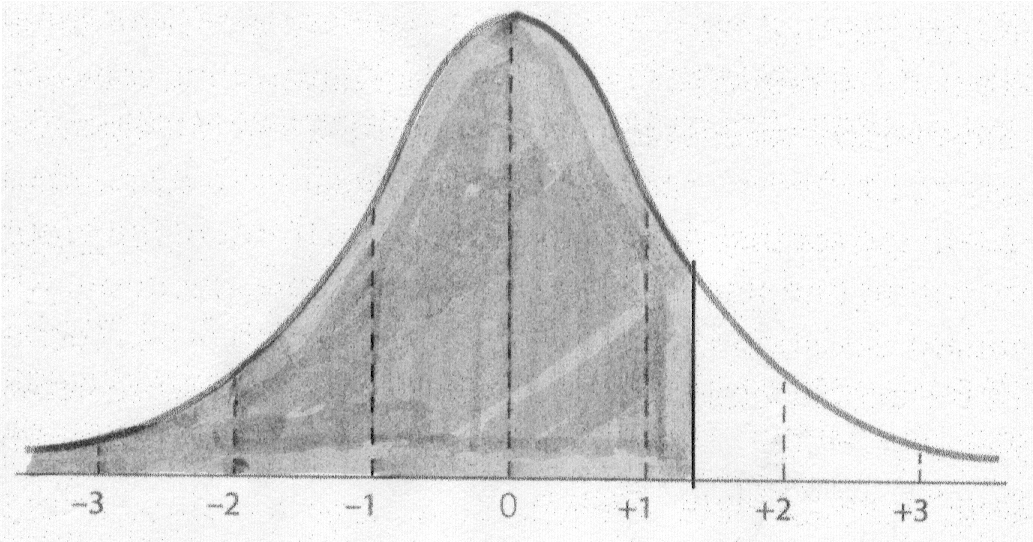
For Question #1,
We look up the z of 0.21 in Column 1 and then find the Column 3 proportion:
.4168.
The answer to Question #1 is:
The proportion of the class that scored below
you on the exam is .4168.
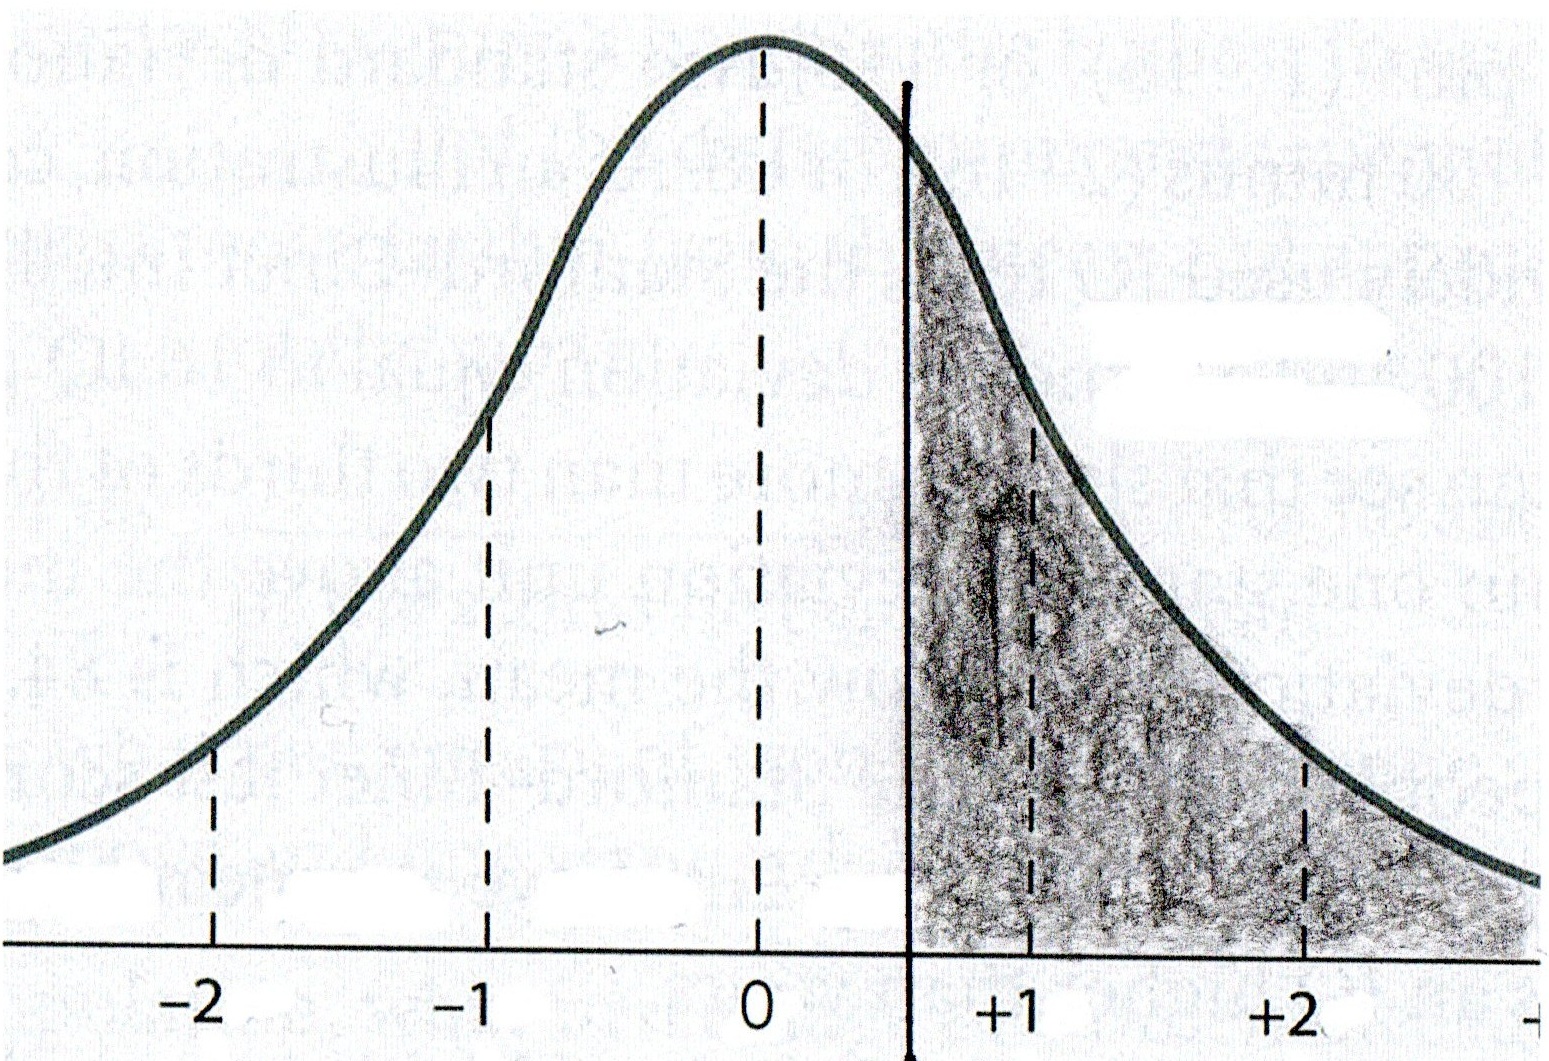
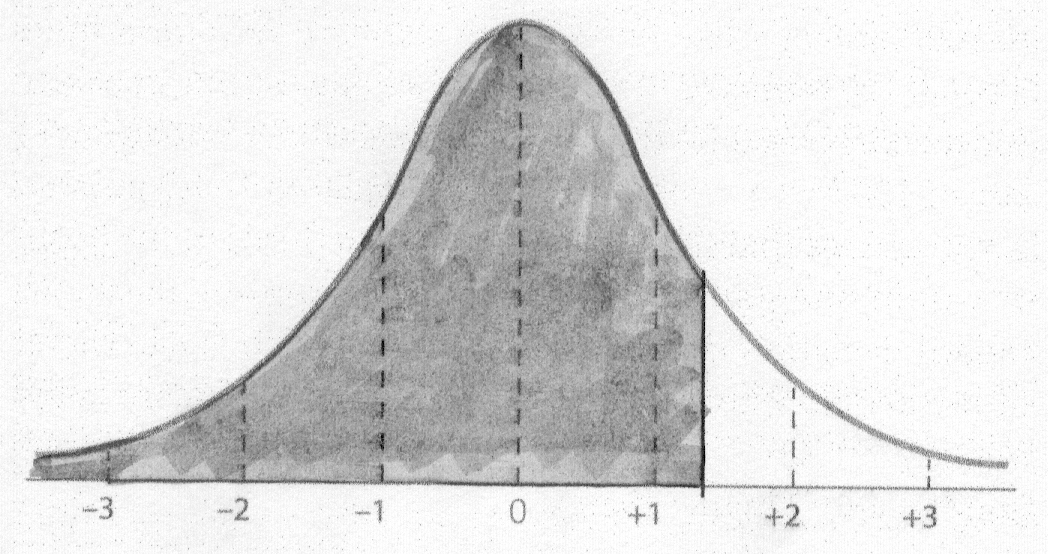
Question #2: The mean of Dr. Morrissette's first statistics exam was
71. The standard deviation was 14. If you received an 89 on the test, what
proportion of people scored below you?
Step 1:
Draw a Normal Curve with z score mean and standard deviations.
Step 2: Calculate the z score.
z = (89 - 71) / 14
z = 1.29
Step 3: Identify the z score on your Normal Curve.
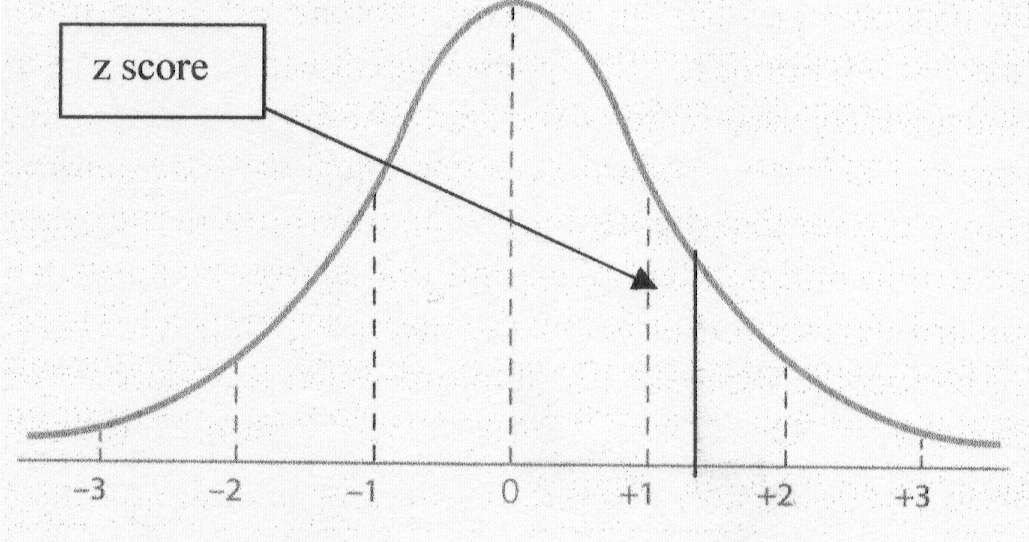
Step 4: Shade the area asked for in the question.
Step 5: Go to the Z Table and find the proportion.
Remember that the Z Table only gives you proportions for half of
the Normal Curve. For this problem we want a proportion that is more than half
of the Normal Curve. So in this case we go to the Z Table and find the
proportion from the z to the mean and then add .5000 to that value to give us
the total area in question
For Question #2,
We look up the z of 1.29 in Column 1 and then find the Column 2 proportion:
.4015.
Then we add .5000 to that column 2 proportion to
account for the entire shaded area.
The answer to Question #2 is:
The proportion of the class that scored below
you on the exam is .9015.
Question #3: The mean of Dr. Morrissette's first statistics exam was
71. The standard deviation was 14. If you received an 79 on the test, what
proportion of people scored above you?
This question is sort of the mirror image of Question #1, so it is
calculated the same way.
Step 1:
Draw a Normal Curve with z score mean and standard deviations.
Step 2: Calculate the z score.
z = (79 - 71) / 14
z = 0.57
Step 3: Identify the z score on your Normal Curve.
Step 4: Shade the area asked for in the question.
Step 5: Go to the Z Table and find the proportion.
For Question #3,
We look up the z of 0.57 in Column 1 and then find the Column 3 proportion:
.2843.
The answer to Question #3 is:
The proportion of the class that scored above
you on the exam is .2843.
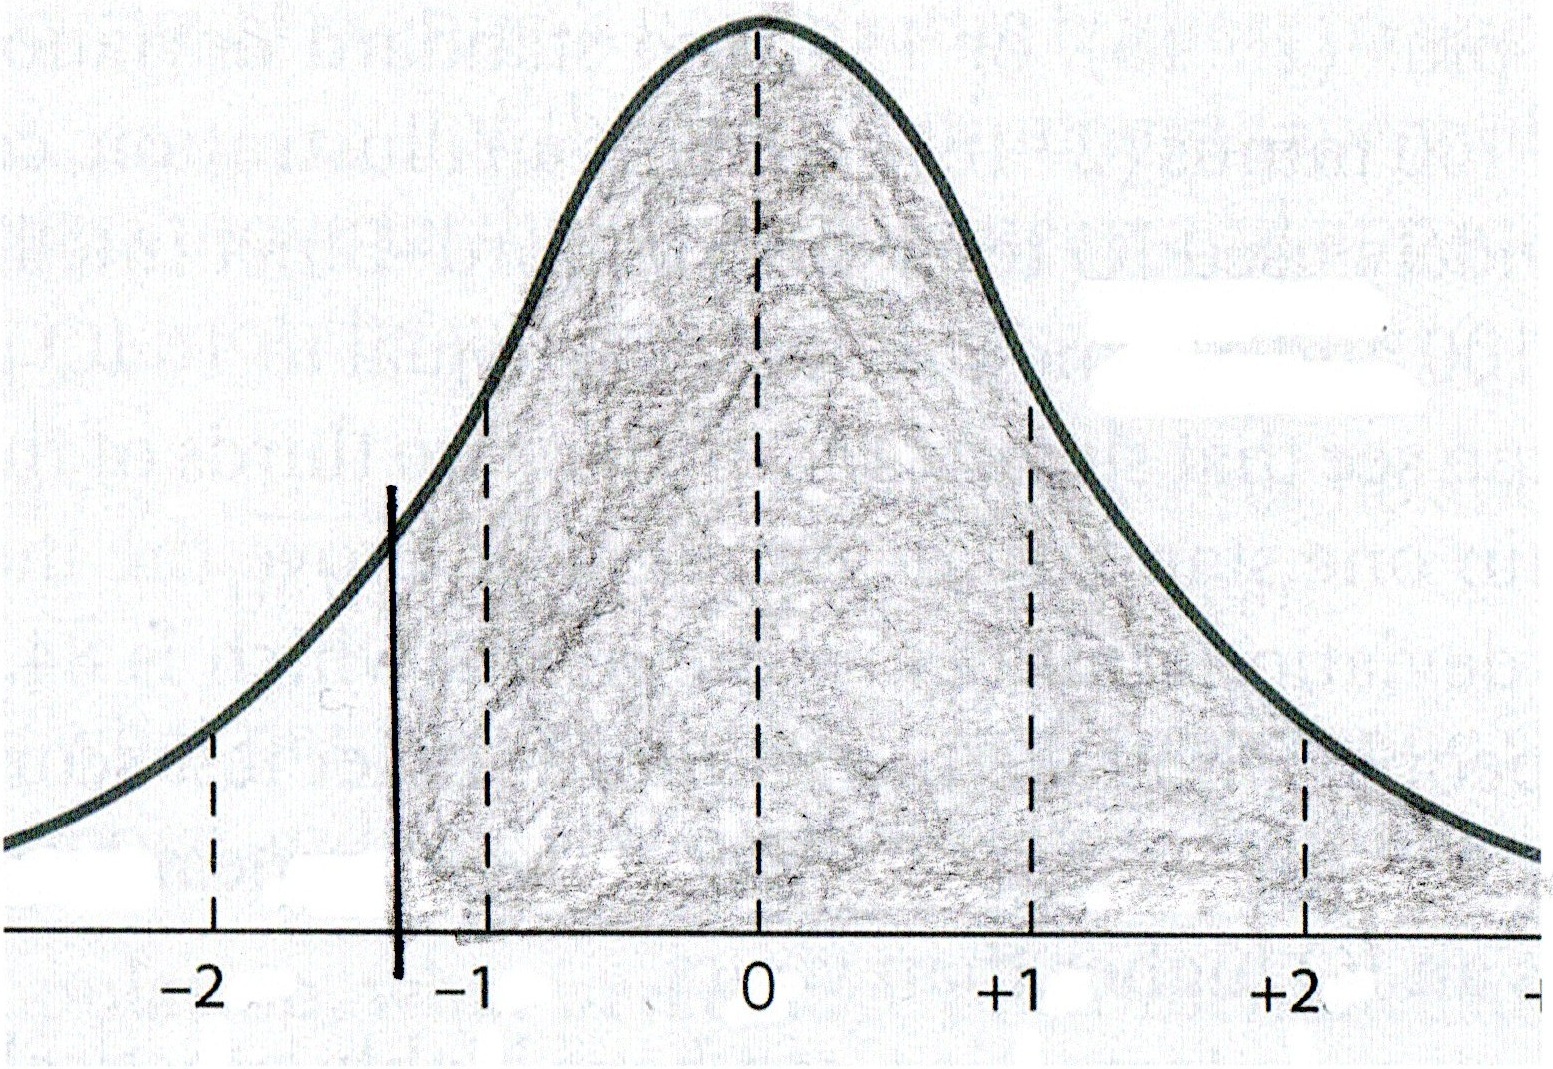
Question #4: The mean of Dr. Morrissette's first statistics exam was
71. The standard deviation was 14. If you received an 55 on the test, what
proportion of people scored above you?
This question is sort of the mirror image of Question #2, so it is
calculated the same way.
Step 1:
Draw a Normal Curve with z score mean and standard deviations.
Step 2: Calculate the z score.
z = (55 - 71) / 14
z = -1.14
Step 3: Identify the z score on your Normal Curve.
Step 4: Shade the area asked for in the question.
Step 5: Go to the Z Table and find the proportion.
For Question #4,
We look up the z of 1.14 in Column 1 and then find the Column 2 proportion:
.3729.
Then we add .5000 to that column 2 proportion to
account for the entire shaded area.
The answer to Question #4 is:
The proportion of the class that scored above
you on the exam is .8729.
Question #5: The mean of Dr. Morrissette's first statistics exam was
71. The standard deviation was 14. If Alicia received a 60 and Latika
received a 90, what proportion of people scored between Alicia and Latika?
Step 1:
Draw a Normal Curve with z score mean and standard deviations.
Step 2: Calculate each z score.
z = (60 - 71) / 14
z = (90 - 71) / 14
z = -0.79
z = 1.36
Step 3: Identify each z score on your Normal Curve.
Step 4: Shade the area asked for in the question.
Step 5: Go to the Z Table and find each proportion and add them
together.
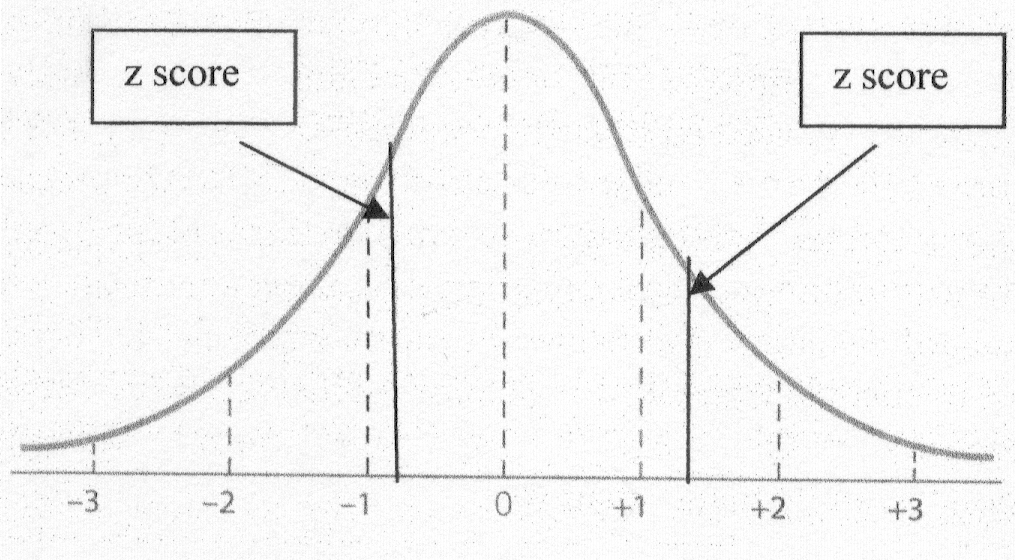
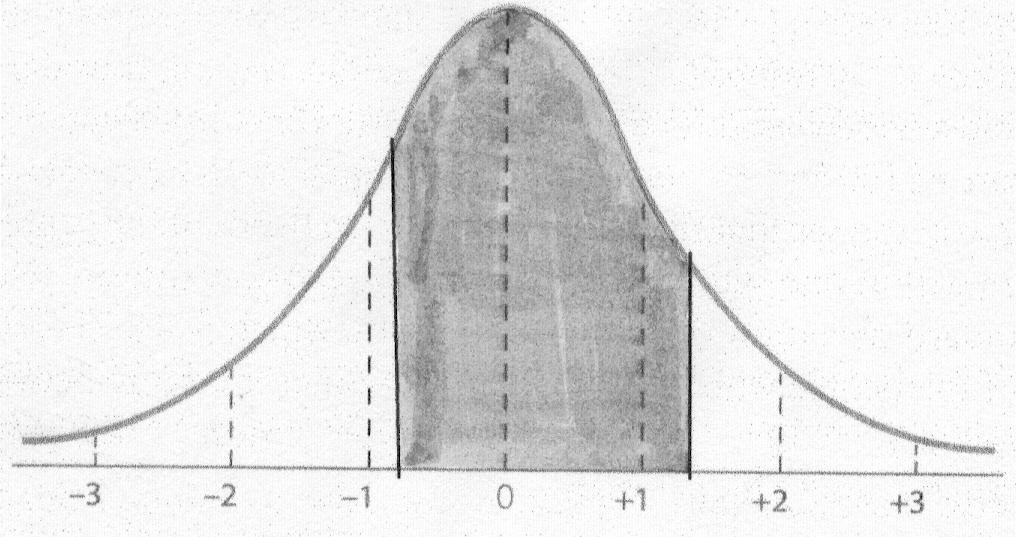
For Question #5,
We look up the z of -0.79 in Column 1 and then find the Column 2 proportion:
.2852.
We look up the z of 1.36 in Column 1 and then find the
Column 2 proportion: .4131.
Then we add the two proportions together to account
for the entire shaded area.
The answer to Question #5 is:
The proportion of the class that scored
between Alicia's score and Latika's score is .6983.
Question #6: The mean of Dr. Morrissette's first statistics exam was
71. The standard deviation was 14. If Tony received a 55 and Rhonda
received a 66, what proportion of people scored between Tony and Rhonda?
Step 1:
Draw a Normal Curve with z score mean and standard deviations.
Step 2: Calculate each z score.
z = (55 - 71) / 14
z = (66 - 71) /b 14
z = -1.14
z = -0.36
Step 3: Identify each z score on your Normal Curve.
Step 4: Shade the area asked for in the question.
Step 5: Go to the Z Table and find each proportion and subtract the
smaller from the larger.
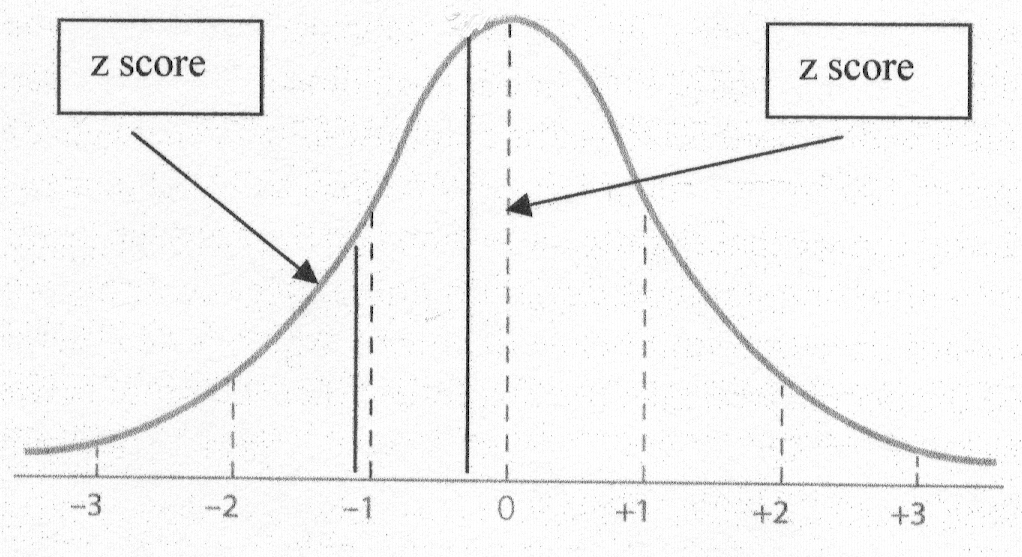
For Question #6,
We look up the z of -1.14 in Column 1 and then find the Column 2 proportion:
.3729.
We look up the z of -0.36 in Column 1 and then find
the Column 2 proportion: .1406.
Then we subtract the smaller proportion from the
larger to account for the entire shaded area.
The answer to Question #6 is:
The proportion of the class that scored
between Tony's score and Rhonda's score is .2323.
Question #7: The mean of Dr. Morrissette's first statistics exam was
71. The standard deviation was 14. If Horatio scored better than 88% of his
classmates, what score did he get?
(Note: this question is the same as asking: What
score represents the 88th percentile?)
Step 1:
Draw a Normal Curve with z score mean and standard deviations.
Step 2: Shade the estimated area asked for in the question.
Step 3: Convert the percentage to a proportion.
88% = .8800
Step 4: Go to the P Table and find the proportion.
The
P Table is located in Appendix A in the back of the text book. It starts on page
432 and gives the proportions of area under the Normal Curve for all
Percentiles. A Percentile is a score that has certain percentage of
scores below it. The P Table has three very important columns:
Column 1: lists proportions for The Larger Area of the Normal Curve
(Percentiles at 50% and above)
| The Larger Area |
z |
The Smaller Area |
The Larger Area |
z |
The Smaller Area |
| 1 |
2 |
3 |
1 |
2 |
3 |
| .500 |
0.0000 |
.500 |
.625 |
0.3186 |
.375 |
| .505 |
0.0125 |
.495 |
.630 |
0.3319 |
.370 |
| .510 |
0.0251 |
.490 |
.635 |
0.3451 |
.365 |
| .515 |
0.0376 |
.485 |
.640 |
0.3585 |
.360 |
| .520 |
0.0502 |
.480 |
.645 |
0.3719 |
.355 |
| |
|
|
|
|
|
| .525 |
0.0627 |
.475 |
.650 |
0.3853 |
.350 |
| .530 |
0.0753 |
.470 |
.655 |
0.3989 |
.345 |
The table continues for 5 more pages
Column 2: lists the z scores relative to the
proportions.
| The Larger Area |
z |
The Smaller Area |
The Larger Area |
z |
The Smaller Area |
| 1 |
2 |
3 |
1 |
2 |
3 |
| .500 |
0.0000 |
.500 |
.625 |
0.3186 |
.375 |
| .505 |
0.0125 |
.495 |
.630 |
0.3319 |
.370 |
| .510 |
0.0251 |
.490 |
.635 |
0.3451 |
.365 |
| .515 |
0.0376 |
.485 |
.640 |
0.3585 |
.360 |
| .520 |
0.0502 |
.480 |
.645 |
0.3719 |
.355 |
| |
|
|
|
|
|
| .525 |
0.0627 |
.475 |
.650 |
0.3853 |
.350 |
| .530 |
0.0753 |
.470 |
.655 |
0.3989 |
.345 |
Column 3: lists proportions for The Smaller Area of the Normal
Curve (Percentiles at 50% and below)
| The Larger Area |
z |
The Smaller Area |
The Larger Area |
z |
The Smaller Area |
| 1 |
2 |
3 |
1 |
2 |
3 |
| .500 |
0.0000 |
.500 |
.625 |
0.3186 |
.375 |
| .505 |
0.0125 |
.495 |
.630 |
0.3319 |
.370 |
| .510 |
0.0251 |
.490 |
.635 |
0.3451 |
.365 |
| .515 |
0.0376 |
.485 |
.640 |
0.3585 |
.360 |
| .520 |
0.0502 |
.480 |
.645 |
0.3719 |
.355 |
| |
|
|
|
|
|
| .525 |
0.0627 |
.475 |
.650 |
0.3853 |
.350 |
| .530 |
0.0753 |
.470 |
.655 |
0.3989 |
.345 |
According to the P Table, the proportion .880 has a z score of
1.1750.
Step 5: Convert the z score into a raw score.
We do that with the following formula:
X = (s)(z) + Xbar
X = (14)(1.1750) + 71
X = 87.45
The answer to Question #7 is:
Horatio got a score of 87.45.
A
Note of Caution!: If the percentile is below 50 then the z
score will be negative (all z scores to the left of the mean are negative). This
will NOT be shown in the P Table. You need to make sure you add the negative
sign to the z score when you calculate your X value.
Entire Z Table
Entire P Table
Additional Videos on the Concepts that might help:
z scores
Using the z score
table
Normal
Distribution and z scores
Normal
Distribution
z score
Calculations and Percentiles in a Normal Distribution