|
Statistics for the Behavioral
Sciences |
Lesson
8
Linear Regression |
Roger N. Morrissette, PhD |
I. Linear Regression (Video
Lesson 8 I) (YouTube version)
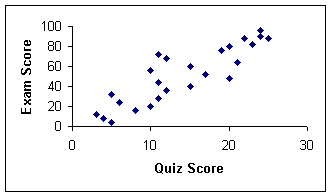
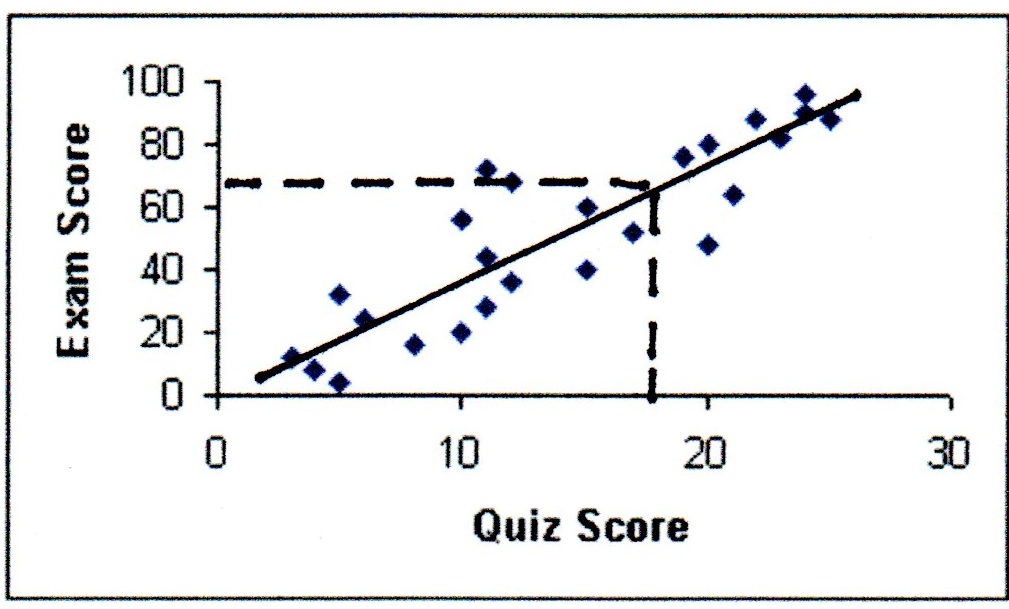
In lesson 7 we generated scatterplots and
calculated correlation coefficients to determine the relationship between two
variables. Linear Regression allows us to use this correlation data of the
relationship between two variables to predict one variable from another.
If we know the correlation between
X and Y then regression will allow us to predict a Y value from any given X
value. Likewise, regression also allows us to predict an X value from any
given Y, as long as we have the correlation coefficient of X and Y. There
are several ways to calculate a linear regression. I have chosen to focus on
what I feel is the simplest raw score formula for regression. The next
section describes how to calculate predicted X (X') and predicted Y (Y')
values.
The first thing to know
about calculating a linear regression is that there are two types of predictions
you can make. You can predict an X from a given Y. This is called solving for
predicted X and is symbolized as X' (read X prime). The other
prediction is to predict a Y from a given X. This is called solving for
predicted Y and is symbolized with Y' (read Y prime). Both
formulas are given below.
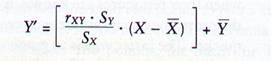
To predict X from Y use this raw
score formula:

The formula reads: X
prime equals the correlation of X:Y multiplied by the standard deviation of X,
then divided by the standard deviation of Y. Next multiple the sum by Y - Y bar
(mean of Y). Finally take this whole sum and add it to X bar (mean of
X).
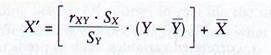
To predict Y from X use this raw score formula:
The formula reads: Y
prime equals the correlation of X:Y multiplied by the standard deviation of Y,
then divided by the standard deviation of X. Next multiple the sum by X - X bar
(mean of X). Finally take this whole sum and add it to Y bar (mean of
Y).
For these formulas:
X =
the raw score from the X variable
Y =
the raw score from the Y variable
rXY
= the correlation between the X and Y variable
SY
= the standard deviation of the Y variable
SX
= the standard deviation of the X variable
X bar
= the mean of the X variable
Y bar
= the mean of the Y variable
Let's use our same two
variables from chapter 8, depression and self-esteem to solve for both a
predicted X and a predicted Y. The table below shows both the depression and self-esteem scores.
|
Depression (X) |
Self-Esteem (Y) |
|
10 |
104 |
|
12 |
100 |
|
19 |
98 |
|
4 |
150 |
|
25 |
75 |
|
15 |
105 |
|
21 |
82 |
|
7 |
133 |
To solve the predicted X or Y formulas we need some summary data.
Specifically we need the means of each group, the standard deviations of each
group, and the correlation coefficient for X:Y. The table below gives the summary
data needed to solve our regression formulas.
| |
Depression
(X) |
|
Self-Esteem (Y) |
|
Mean |
14.125 |
|
105.875 |
|
Standard Deviation |
7.220 |
|
24.805 |
|
Correlation Coefficient |
|
-0.924 |
|
Let's say a patient has a self-esteem score of 76. What would be
their predicted depression score?
To solve this question we need to use the predicted X formula:
X' = [ [ (-0.924 x 7.220) / 24.805] x (76 - 105.875)] + 14.125
X' = [ (-6.671 / 24.805) x (-29.875)] + 14.125
X' = [ (-0.269) x (-29.875)] + 14.125
X' = 8.035 + 14.125
X' = 22.160
The predicted depression score (X') for a self-esteem score of
76 would be 22.160.
Now let's say a patient has a depression score of 11. What would
be their predicted self-esteem score?
To solve this question we need to use the predicted Y formula:

Y' = [ [ (-0.924 x 24.805) / 7.220] x (11 - 14.125)] + 105.875
Y' = [ (-22.920 / 7.220) x (-3.125] + 105.875
Y' = [ (-3.175) x (-3.125)] + 105.875
Y' = 9.922 + 105.875
Y' = 115.797
The predicted self-esteem score (Y') for a depression score of
11 would be 115.797.
IV. The Standard Error of Estimate (Video
Lesson 8 IV) (YouTube version)
The error involved in conducting a linear regression is calculated by using the standard error of estimate or
simply standard error for short. It is the measure of variability
for linear regression. There are two standard error formulas: one for the
predicted X value (SXY), and one for the predicted Y value (SYX).
Standard Error for predicted X:
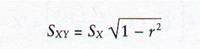
The formula reads:
Standard Error of X from Y equals the standard deviation of X multiplied by the
square root of 1 minus the square of the correlation between X and Y.
For our example above the
Standard Error of all of the X' scores would be:
SXY
= (7.220) x [Square Root of (1 - (-0.924)2)]
SXY
= (7.220) x [Square Root of (1 - 0.854)]
SXY
= (7.220) x (Square Root of (0.146)]
SXY
= (7.220) x (0.382)
SXY = 2.758
Standard Error for predicted Y:

The formula reads: Standard Error of Y from X equals the standard deviation of Y
multiplied by the square root of 1 minus the square of the correlation between X
and Y.
For our example above the
Standard Error of all of the Y' scores would be:
SYX
= (24.805) x [Square Root of (1 - (-0.924)2)]
SYX
= (24.805) x [Square Root of (1 - 0.854)]
SYX
= (24.805) x (Square Root of (0.146)]
SYX
= (24.805) x (0.382)
SYX =
9.476
Additional Links about the Concepts that might
help:
WARNING! The links below use different formulas for
Linear Regression than the ones used in my lesson.
If any of these confuse you then ignore them and
return to my lesson!
Introduction to Regression
Introduction to Regression
Analysis
What is Regression?